

· Gold prices rose to their highest in a month and a half on Tuesday, as soft economic data out of the United States and concerns about an interim Sino-U.S. trade deal lent support to the safe-haven bullion.
Spot gold rose to $1,490 per ounce by 0340 GMT. Earlier in the day, prices hit their highest since Nov. 7 at $1,491.79. U.S. gold futures also edged up 0.3%, to $1,494.80.
· Data on Monday showed new orders for key U.S.-made capital goods barely rose in November and shipments fell, suggesting business investment will probably remain a drag on economic growth in the fourth quarter.
· “The weaker U.S. economic data is starting to show up ... there are still concerns that the current level of tariffs will continue to weigh on the U.S. economy as we enter into 2020,” said Stephen Innes, a market strategist at AxiTrader.
Adding to concerns, Canada’s economy unexpectedly shrank by 0.1% in October, the first monthly decline since February, partly because of a U.S. auto strike that hit manufacturing.
· Gold is considered an alternative investment during times of political and financial uncertainty.
On the trade front, investors awaited further developments on the ‘phase one’ deal between the world’s top two economies.
· “We are still not 100% clear if the ‘phase one’ deal will go through or not, it has not been signed yet ... we then pivot to ‘phase two’ that suggests you need some gold, because we don’t know what the next phase is all about, how contentious of a deal that is going to be,” Innes added.
Gold was on track for its best year since 2010 with a 16% gain, mainly due to the 17-month tariff dispute that has roiled the global financial markets.
· Even as Beijing and Washington have taken steps to defuse their dispute, they diverge on a slew of issues, including anti-government protests in Hong Kong and the treatment of Muslim Uighur minority.
· Asian shares and U.S. stock futures darted in and out of losses on Tuesday as the holiday lull offset optimism of a trade deal.
· Trading is expected to be subdued in many financial markets ahead of the Christmas holidays.
· Elsewhere, silver rose 0.7% to $17.54 per ounce, after scaling its highest since Nov. 7 at $17.57 earlier in the session.
· Palladium was down 0.1% to $1,874.48 per ounce, while platinum was flat at $935.89.
· It's getting to feel a lot like a gold Christmas rally
Although gold does not have seasonal tendencies like many commodities such as grains, there are holidays that boost demand like Diwali in India, and Chinese New Year’s. There has also been a recent trend of gold railing between December and January over the last few years.
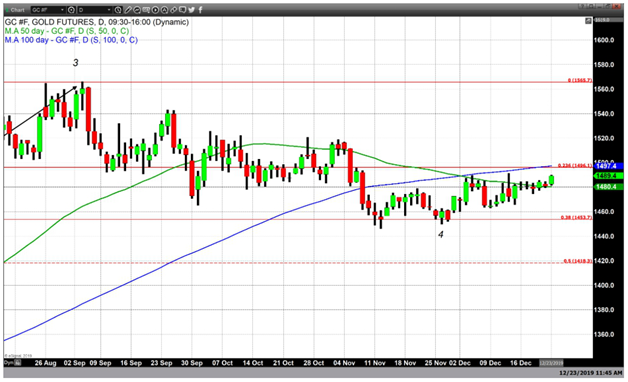
Today gold traded moderately higher, and as of 4:40 PM EST is pegged at $1489.10, which is a net gain of $8.20 on the day (+0.55%). On a technical basis what is significant is that gold opened today at $1482.40, which is just above its 50-day moving average currently at $1480.40.
Throughout the remainder of the day gold traded and closed above that critical price point. In the mind of a market technician as long as gold can maintain pricing above the 50-day moving average it indicates that gold currently is in a bullish trend. If the trend continues the 50-day moving average will define a critical level of support.
Currently resistance can be found just below $1500 per ounce and is based upon two technical studies. The first study is the 100-day moving average which is currently fixed at $1497.40, and right at that same price point is the 23.6% Fibonacci retracement which is fixed at $1496.10. The fact that both of these studies occur roughly at the same price point is significant in that it strengthens the likelihood that this price point will be an area of resistance. Add to that the fact that just above that is the key psychological level of $1500 an ounce. But if history repeats itself as it tends to do and this year mimics the last four consecutive years in terms of price moves between December and January than we could be certainly in for a Christmas rally and a New Year’s rally.
· The metal’s drop from Septembre highs above $1550 to $1440 in November indicates the market has priced in Fed’s rate cut pause. On a quarter-to-date basis, gold is currently up just 0.34%.
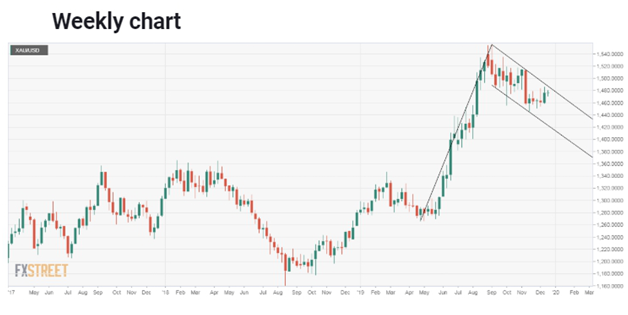
· Gold has formed a classic bull flag pattern – a pause that usually refreshes the preceding bull move.
A breakout looks likely and would imply a continuation of the rally from lows near $1265 in April and open the doors to $1,850 (target as per the measured move method).
On the way higher, gold will likely encounter resistance at the September 2019 high of $1557 and $1600 (psychological resistance).
If prices find acceptance under the November low of $1445, then a deeper pullback to $1400-$1300 could be seen.
Reference: CNBC, FXStreet,Kitco
